
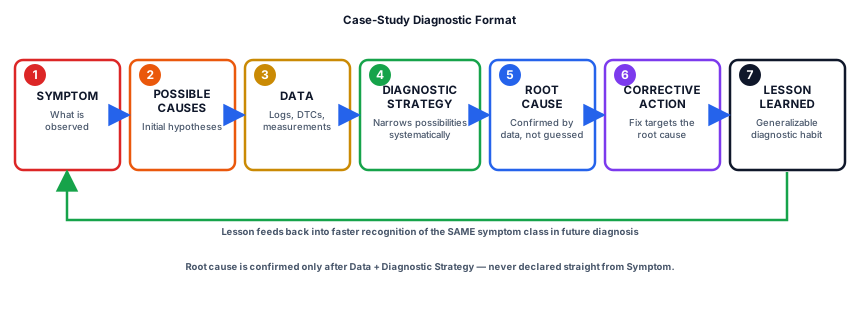
- Apply the case-study format (SYMPTOM → POSSIBLE CAUSES → DATA → DIAGNOSTIC STRATEGY → ROOT CAUSE → CORRECTIVE ACTION → LESSON LEARNED).
- Explain why data collection must precede hypothesis narrowing in fault diagnosis.
- Distinguish a symptom from its root cause in three generic, anonymized EV fault scenarios.
- State why case studies in this lesson are generic engineering scenarios, not verified real-vehicle incidents.
- Extract a generalizable diagnostic habit from each case that applies beyond the specific scenario described.
EV-50 — Case Studies
ASSUMPTION — Every case below is a generic, anonymized engineering scenario constructed for teaching purposes. None of them describes, references, or is based on a specific OEM vehicle, a specific reported incident, or any real fault data. Any resemblance to a real event is coincidental; treat all figures as illustrative orders of magnitude, not measured values.
1. Why a Structured Case Format Matters
Fault diagnosis on a complex system like an EV is easy to do badly: a technician or engineer sees a symptom, jumps to the most familiar-sounding cause, replaces a part, and either fixes the problem by luck or fails to and burns time and cost in the process. A structured format resists this by forcing a deliberate separation between what was observed, what data was actually gathered, and what was concluded — so that a plausible-sounding cause never gets treated as confirmed until the data supports it. The format used in every case below is:
SYMPTOM → POSSIBLE CAUSES → DATA → DIAGNOSTIC STRATEGY → ROOT CAUSE → CORRECTIVE ACTION → LESSON LEARNEDFACT — The order matters. POSSIBLE CAUSES is deliberately placed before DATA, reflecting real practice — you form initial hypotheses from experience — but ROOT CAUSE is not allowed to be declared until DATA and DIAGNOSTIC STRATEGY have actually narrowed the possibilities. Skipping straight from a symptom to a “root cause” without that narrowing step is one of the most common diagnostic mistakes in practice.
2. Case 1: Vehicle Will Not Enter “Ready” State
SYMPTOM — The driver turns the ignition on; the vehicle’s “ready to drive” indicator never illuminates, and the vehicle cannot be driven.
POSSIBLE CAUSES — A low-voltage (12V/48V auxiliary) battery too weak to energize the contactor coils; an open HVIL loop (see EV-12) from a connector not fully seated; a failed main contactor; a pre-charge circuit fault preventing the DC-link from reaching the voltage needed before the main contactor is allowed to close.
DATA — A diagnostic read shows a stored fault code indicating low auxiliary-battery voltage, alongside a separate contactor-related fault. Auxiliary battery voltage measured at rest is below the vehicle’s normal operating range.
DIAGNOSTIC STRATEGY — Rather than replacing the contactor first (the more expensive, more “interesting” component), the systematic approach starts at the simplest, most common failure point in this class of fault: measure auxiliary battery voltage under load, then check HVIL continuity, then observe the contactor-closing sequence.
ROOT CAUSE — The auxiliary battery’s voltage sags too far under the load of energizing the contactor coils, so the contactors never close even though the HV battery itself and the main contactor hardware are functioning correctly.
CORRECTIVE ACTION — Replace the degraded auxiliary battery; confirm the “ready” sequence completes normally afterward.
LESSON LEARNED — A “no ready state” symptom does not, by itself, indicate an HV-side fault. Because the entire HV-enabling sequence depends on a functioning low-voltage system to energize contactors and control units in the first place, checking the auxiliary battery first is both the cheapest and statistically the most productive diagnostic step for this symptom class — a case of the least glamorous component being the actual cause.
3. Case 2: DC Fast-Charging Session Repeatedly Tapers or Stops Early
SYMPTOM — A vehicle begins DC fast charging normally, but charging power drops sharply (tapers) much earlier than expected, or the session ends before the target state of charge is reached, on a day with high ambient temperature.
POSSIBLE CAUSES — Battery temperature exceeding the safe charging window, triggering thermal derating; a charge-limit set intentionally by the BMS based on state of charge or state of health; a communication fault between vehicle and charger; an isolation-monitoring fault (see EV-12) forcing a conservative charging profile.
DATA — Logged battery temperature during the session shows a steady rise that correlates closely with the point where charging power begins tapering; no isolation or communication fault codes are present; state of charge and state of health are within normal range for the vehicle’s age and usage.
DIAGNOSTIC STRATEGY — Because the taper point correlates in time with the temperature curve rather than with a fixed state of charge, the investigation follows the thermal path first: review the cooling system’s behavior during the session (coolant flow, chiller activation) rather than assuming a BMS or communication defect.
ROOT CAUSE — The battery’s thermal management system is not removing heat fast enough during sustained high-current charging combined with high ambient temperature, so the BMS’s thermal-protection logic correctly reduces charging current to keep the pack within its safe temperature limits — this is the system working as intended, not a fault, though the underlying cooling performance may still be a legitimate area for engineering review (see EV-14).
CORRECTIVE ACTION — Recommend battery preconditioning before a planned fast-charging stop (bringing the pack to an optimal temperature range in advance) and route further engineering review toward cooling-system capacity rather than the charging hardware itself.
LESSON LEARNED — Thermal derating during fast charging is frequently mistaken for a hardware fault when it is, correctly, a protective response. Distinguishing “the system did its job” from “the system is broken” requires looking at the underlying physical quantity (temperature) driving the behavior, not just the visible symptom (reduced charging speed).
4. Case 3: Intermittent Reduced-Power Warning During Normal Driving
SYMPTOM — During otherwise normal driving, a fleet operator reports that several vehicles occasionally display a reduced-power warning for a short period, then return to normal operation without any stored hard fault.
POSSIBLE CAUSES — A transient high-voltage isolation anomaly; a software timing issue in the coordination between the VCU and the inverter (see EV-15 and EV-16); a marginal connector or wiring-harness issue that intermittently affects a sensor reading; a cooling-system response lagging a rapid, repeated acceleration pattern typical of certain routes.
DATA — Because the fault is intermittent and no hard fault code persists, the fleet’s aggregated telematics data (see EV-49) is reviewed across many vehicles and trips rather than relying on a single vehicle’s isolated report. The pattern shows the warning correlates with a specific route profile involving repeated, closely spaced acceleration events, and occurs more often on vehicles with higher mileage.
DIAGNOSTIC STRATEGY — A single-vehicle inspection would likely find nothing, since the fault does not persist. The fleet-level, data-driven approach — comparing many vehicles and trips against a common route and usage pattern — is what actually surfaces the correlation, illustrating why aggregated fleet telematics is diagnostically valuable beyond its operational uses described in EV-49.
ROOT CAUSE — Repeated, closely spaced high-power acceleration events on this route momentarily push a power-electronics component close to its thermal or software-defined safety margin, and a conservative protective algorithm briefly reduces available power as a precaution; higher-mileage vehicles show it more often due to minor performance drift in the cooling or power-electronics components over their service life.
CORRECTIVE ACTION — A software calibration update adjusts the margin and response curve based on the aggregated data, and affected vehicles receive the update via OTA (see EV-49); high-mileage vehicles are flagged for a routine cooling-system inspection at their next scheduled service.
LESSON LEARNED — Intermittent, non-persistent faults are often invisible at the single-vehicle level and only become diagnosable with aggregated data across a fleet; this is a strong practical argument for fleet telematics as a diagnostic tool, not just an operational one.
5. FAQ
What do case studies like these actually teach, beyond the specific fault?
FACT — They teach a transferable diagnostic discipline: separate symptom from cause, gather data before committing to a hypothesis, and follow the data even when it points away from the most “interesting” or expensive component.
Why does this lesson use invented, anonymized scenarios instead of real incidents?
FACT — Citing a specific brand or model with an unverifiable fault claim risks stating something false or misleading about a real product, which this lesson’s sourcing standard does not allow. Generic scenarios preserve the diagnostic logic — which is what is actually being taught — without making any unverifiable claim about a real vehicle.
Is thermal derating during fast charging always a sign of a problem?
INTERPRETATION — Not necessarily. As Case 2 shows, it can be the thermal-protection system correctly limiting current to stay within a safe temperature range; whether the underlying cooling performance itself warrants improvement is a separate engineering question from whether the derating event itself indicates a fault.
6. Summary
- The structured case format (SYMPTOM → POSSIBLE CAUSES → DATA → DIAGNOSTIC STRATEGY → ROOT CAUSE → CORRECTIVE ACTION → LESSON LEARNED) prevents jumping from a symptom straight to an unverified conclusion.
- Case 1 shows that a “no ready” symptom is statistically more often a weak auxiliary battery than an HV-side fault.
- Case 2 shows that thermal derating during fast charging can be the protection system working correctly, not a defect, and that distinguishing the two requires looking at the driving physical quantity, not just the visible symptom.
- Case 3 shows that intermittent, non-persistent faults often require fleet-level aggregated data to diagnose, since single-vehicle inspection may find nothing.
- All three cases are generic, anonymized teaching scenarios, not real vehicle incidents — the diagnostic habits they illustrate are what generalizes, not the specific numbers.
7. Sources and Verification Note
The cases in this lesson are constructed teaching scenarios; they are not derived from any specific real vehicle’s fault data or public incident report.
- ISO 14229 (UDS) — Unified Diagnostic Services, the general standard framework for vehicle diagnostic communication referenced conceptually.
- SAE J1930 (general fault-code terminology reference) — general terminology reference for diagnostic trouble codes.
ASSUMPTION — Source versions/titles may change; every source must be re-verified before publication.
Next Lesson
- This is the final EV Academy lesson. See the BMS Academy and other modules for more.
Technical Diagrams
Quiz
What order does a case study follow?
A case study follows SYMPTOM → … → LESSON LEARNED.
What is the root cause?
The root cause is the actual source of the fault.
In 'vehicle won't go READY', what is the first check?
In a no-READY scenario, check 12V first.
What is a possible cause of DC charging cutting off?
DC charging cutoff is usually thermal derating or an SOC limit.
What does a lesson learned provide?
A lesson learned helps prevent similar future faults.