
- Explain why fixed test procedures cannot validate the effectively infinite state space of autonomous driving.
- Construct the functional, logical, and concrete scenario hierarchy, and generate many test variations from a single template.
- Understand the standard structure of the ASAM OpenSCENARIO and OpenDRIVE data models and why they are necessary.
- Mathematically compute the TTC, ETTC, PET, and DRAC safety metrics and relate them to AD-22's simulation pyramid.
- Distinguish the RSS (Responsibility-Sensitive Safety) model's mathematically provable safety approach from pure statistical simulation confidence.
AD-23 — Scenario-Based Testing Methodology and Safety Metrics
FACT — The overwhelming majority of highway kilometers driven (well over 99%) are uneventful: a straight lane, constant speed, predictable traffic. Classical automotive testing (“drive this exact course, check these specific things”) is therefore insufficient for autonomous driving — the system is truly tested in the small but critical fraction of situations outside that 99%. This lesson covers the scenario-based testing methodology that systematically defines those critical situations, and the safety metrics that quantify numerically how “critical” or “safe” a given scenario turned out to be.
In this lesson, you will learn:
- Why Fixed Test Procedures Fall Short — the infinite state-space problem.
- The Scenario Hierarchy — functional, logical, and concrete scenarios; many variations from a single template.
- ASAM OpenDRIVE and OpenSCENARIO — the standards that make scenarios portable across simulators.
- Safety Metrics — TTC, ETTC, PET, DRAC; the link back to AD-12’s AEB thresholds.
- RSS (Responsibility-Sensitive Safety) — a mathematically provable safety envelope.
- Euro NCAP Test Protocols — standardized real-world scenarios.
- Worked Example — end-to-end parameterization of a pedestrian-crossing scenario.
1. Why Fixed Test Procedures Fall Short
Traditional automotive testing (e.g., “measure this braking distance at this speed,” “take this curve at this radius”) relies on a finite, predefined checklist — because a classical vehicle’s behavior is largely a matter of deterministic mechanical/electronic subsystems, and a finite number of tests is enough to cover them.
An autonomous driving system, by contrast, must continuously interpret and respond to an effectively infinite variety of real-world situations: different road users behaving differently under different speed combinations, different lighting/weather conditions, different road geometries. Covering that state space with a fixed checklist is not achievable.
CRITICAL — The failure of fixed test procedures is fundamentally a counting problem: if a single “intersection” scenario has just 4 parameters (ego speed, target speed, target’s lateral speed, initial distance) and each can take only 10 discrete values, that one scenario family already produces distinct concrete test cases. Real-world driving involves dozens of such scenario families and far more parameters. A fixed “test this specific thing this specific way” checklist can never cover this combinatorial explosion — which is why the industry moved to scenario-based testing: instead of fixed test cases, parameterized templates are defined, and those templates are swept systematically.
These templates are derived from three sources: (1) real-world accident and near-miss data, (2) domain expert knowledge (traffic engineers, test drivers), and (3) systematic combinatorial/edge-parameter exploration (deliberately targeting the boundary regions of the parameter space). The resulting scenario library is run in full primarily at the MIL/SIL tiers of the pyramid described in AD-22 — Verification and Validation: MIL, SIL, HIL, VIL, Track and Simulation, because only cloud-scale parallelism makes sweeping this library economically feasible.
2. The Scenario Hierarchy: Functional, Logical, Concrete
Formalized within ISO 21448 (SOTIF) and the German PEGASUS research consortium, scenarios are structured across three abstraction layers:
+--------------------------------------------------------------------------+
| 1. FUNCTIONAL SCENARIO — Natural Language Description                    |
|    "Highway lane change: an adjacent vehicle executes an abrupt cut-in." |
+--------------------------------------------------------------------------+
                                    |
                                    v
+--------------------------------------------------------------------------+
| 2. LOGICAL SCENARIO — Parameter Ranges                                   |
|    - Ego speed:            v_ego   in [80, 130] km/h                     |
|    - Target vehicle speed: v_target in [60, 110] km/h                    |
|    - Lateral crossing speed: v_lat  in [0.5, 3.5] m/s                    |
|    - Initial relative gap: d_rel    in [5, 40] m                         |
+--------------------------------------------------------------------------+
                                    |
                                    v
+--------------------------------------------------------------------------+
| 3. CONCRETE SCENARIO — A Single Deterministic Test Run                   |
|    v_ego = 100 km/h, v_target = 80 km/h, v_lat = 2.0 m/s, d_rel = 15 m  |
+--------------------------------------------------------------------------+
Because each parameter in a logical scenario spans a continuous range, a single logical scenario can theoretically generate an infinite number of concrete scenarios. In practice, engineers keep this space tractable with two techniques:
- Combinatorial Test Design: Parameters are swept systematically via grid or Latin hypercube sampling; each parameter’s extreme values (minimum, maximum, boundary) are specifically targeted because critical behavior tends to emerge at the boundaries.
- Criticality-Based Sampling: Instead of random sweeping, a search algorithm (e.g., Bayesian optimization, evolutionary search) concentrates on parameter regions that previous runs showed produced collisions or low safety margins (see §4) — the goal is finding the “most critical” concrete scenarios with far fewer runs than a random sweep would need.
3. ASAM OpenDRIVE and OpenSCENARIO
To make scenarios portable across different simulators (CARLA, dSPACE, IPG CarMaker, VIRES VTD), different OEMs, and different test facilities, the industry relies on open ASAM standards:
- ASAM OpenDRIVE: Describes the static geometry of the road network — lane widths, curvature/grade profiles, intersection connectivity, traffic signage, road surface properties — in structured XML.
- ASAM OpenSCENARIO: Describes the motion of dynamic actors on the road, their triggers, maneuvers, and environmental conditions (weather, lighting). OpenSCENARIO 2.0 includes a domain-specific language (DSL) supporting rule-based and probabilistic constraints — so behaviors like “vehicle X changes lanes with 80% probability once it closes to within 15-25 m of vehicle Y” can also be defined.
Thanks to this pair of standards, an engineer who defines a “cut-in” scenario in one country can run it, without rewriting anything, on a different simulator or HIL test rig anywhere else.
4. Safety Metrics
Objective, mathematical metrics quantify how “critical” a scenario turned out to be — how “close” it came, even when no actual collision occurred.
A. Time-to-Collision (TTC)
Under co-linear following where the ego vehicle closes on a slower lead vehicle (), assuming the current relative speed holds constant, the time remaining to collision:
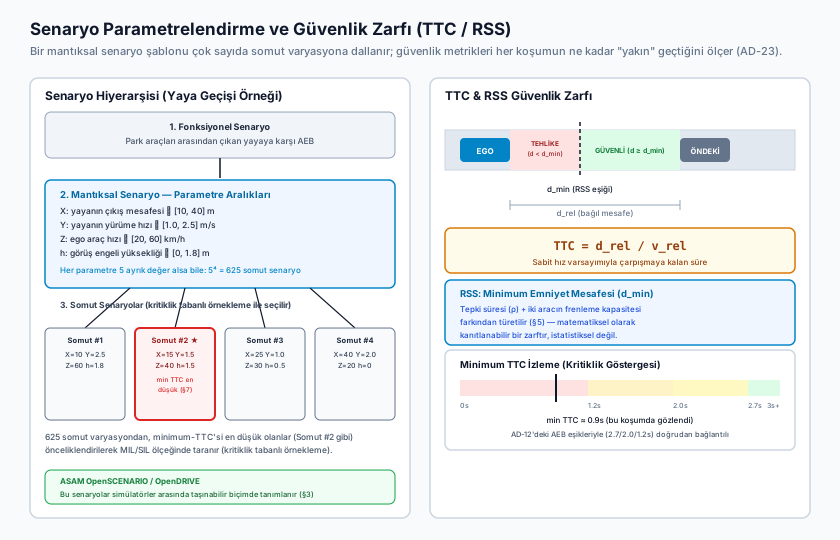
INTERPRETATION — TTC is not just a collision indicator, it is also a “close call” indicator. As we saw in AD-12 — Key ADAS Features: AEB, ACC, LKA, LCA, BSD, RCTA and TSR, production AEB systems use staged TTC thresholds (warning around 2.7 s, brake prefill around 2.0 s, partial braking around 1.6 s, full emergency braking around 1.2 s). Even if a scenario resolves without a collision, if the minimum TTC recorded during the run drops low (say, down to 0.9 s before recovering), that scenario is still worth flagging as a near-miss — a difference of a few centimeters or milliseconds in the real world could have flipped the outcome. This is why scenario libraries track the distribution of minimum TTC, not just the binary “collision / no collision” result.
- : Standard warning/active braking threshold.
- : Critical boundary where avoidance becomes physically difficult and demands maximum deceleration.
B. Enhanced TTC (ETTC)
Accounts for non-zero vehicle accelerations () by finding the smallest positive root of a second-order equation:
Unlike TTC, which assumes constant speed, ETTC gives a more realistic estimate in dynamic scenarios where the lead vehicle brakes or the ego vehicle accelerates.
C. Post-Encroachment Time (PET)
For intersection and crossing scenarios — where vehicle heading vectors are non-collinear and TTC’s "" definition breaks down — PET measures the time gap between the first vehicle exiting a conflict point and the second vehicle reaching that same point:
- : Represents an unacceptably hazardous near-miss.
D. Deceleration Rate to Avoid Collision (DRAC)
The minimum constant deceleration the ego vehicle would need to apply to avoid colliding with the lead vehicle:
FACT — On dry asphalt, passenger vehicles can achieve a peak emergency deceleration of roughly (). On wet pavement this drops to , and on snow/ice to . When the computed DRAC exceeds the available road friction limit (), the collision is physically unavoidable — this is the objective threshold used to distinguish “the system failed” from “physics simply did not allow it.”
5. The Responsibility-Sensitive Safety (RSS) Model
The metrics covered so far (TTC, PET, DRAC) produce statistical/simulation-based confidence: you run the system against thousands or millions of scenario variations and aggregate the results — but this never yields a mathematical proof that “this system will never cause a crash,” only that “it behaved safely across the scenario space that was tested.”
RSS (Responsibility-Sensitive Safety), proposed by Mobileye in 2017, is a formal model that instead aims to define a mathematically provable safety envelope. RSS’s core value proposition is this: a minimum following/lateral distance is derived from first-principles physics (reaction time plus each vehicle’s braking capability), and if the vehicle always maintains that distance, the model mathematically guarantees the vehicle will never be the at-fault party — a fundamentally different, auditable kind of guarantee than the statistical confidence that emerges from aggregating millions of simulation runs.
INTERPRETATION — RSS is one of several such formal safety-envelope frameworks used in the industry, not a universal standard — other manufacturers and research groups have developed similar formal models for the same purpose (e.g., “Safety Force Field”). RSS’s contribution, as a complement to scenario-based statistical testing, is offering an auditable claim of the form “if this specific mathematical rule always holds, responsibility never falls on the ego vehicle” — no matter how broad statistical test coverage gets, it can never fully eliminate the risk of encountering an untested scenario, whereas a formal model like RSS closes that risk by definition (provided its assumptions hold).
RSS rests on five core rules:
- Do not hit the vehicle in front from behind (longitudinal safe distance).
- Do not cut in recklessly (lateral safe distance).
- Right-of-way is given, not taken.
- Exercise caution in areas of occluded visibility.
- If an accident can be avoided without causing another one, it must be avoided.
The minimum longitudinal safe distance () is the mathematical expression of rule 1:
Where:
- : Worst-case perception-to-actuation system latency (e.g., taken as a 0.3-0.5 s design assumption).
- : Worst-case acceleration the ego vehicle can produce during the reaction delay.
- : The ego vehicle’s minimum guaranteed braking capability.
- : The worst-case physical braking deceleration the lead vehicle could apply.
WARNING — Formal models like RSS only provide a guarantee as long as their own assumptions hold — for instance, a physically anomalous vehicle that brakes harder than the assumed , or a perception delay that exceeds , invalidates the model’s guarantee. This is why RSS functions as a layer used alongside, not instead of, scenario-based statistical testing.
6. Standardized Euro NCAP Test Protocols
Euro NCAP defines standardized concrete scenarios in which the metrics above are applied to active safety testing:
| Protocol | Description | Typical Speed Range |
|---|---|---|
| CCRs (Car-to-Car Rear Stationary) | Ego vehicle approaches a stationary target | |
| CCRm (Car-to-Car Rear Moving) | Ego vehicle approaches a target moving at constant speed | Ego , target |
| CCRb (Car-to-Car Rear Braking) | Both vehicles cruise, then the lead vehicle brakes hard | , lead at |
| CPNA/CPFA (Car-to-Pedestrian Nearside/Farside Adult) | AEB response to a pedestrian emerging from between parked cars | Variable |
7. Worked Example: A Pedestrian-Crossing Scenario
Let’s make the hierarchy above concrete end to end — a scenario where a pedestrian steps out in front of the ego vehicle from a given distance, at a given speed:
Functional scenario: “A pedestrian emerges from between parked cars, X meters ahead of the ego vehicle, walking at Y speed, while the ego vehicle travels at Z speed.”
Logical scenario — parameter ranges:
| Parameter | Symbol | Range |
|---|---|---|
| Pedestrian emergence distance | m | |
| Pedestrian walking speed | m/s | |
| Ego vehicle speed | km/h | |
| Sightline occlusion (parked-car height) | m |
Even if each of these four parameters is sampled at only 5 discrete values, this single template produces distinct concrete scenarios; criticality-based sampling prioritizes the combinations within those 625 that yield the lowest minimum TTC — i.e., the hardest cases for AEB to resolve — so they can be swept at MIL/SIL scale.
Concrete scenario example: , , , — this single deterministic run is simulated at a real-time step resolution (), and the minimum TTC, PET (relative to the pedestrian-ego conflict point), and DRAC (if applicable) are recorded.
Frequently Asked Questions (FAQ)
Q: Why does TTC fail on its own at roundabouts? A: TTC assumes linear, same-lane motion. At roundabouts or angled intersections, vehicle heading vectors differ and there is no shared "" definition. These scenarios instead use the PET (Post-Encroachment Time) metric defined in §4.C.
Q: Why do autonomous vehicle scenarios include evasive steering maneuvers, not just braking? A: At high speeds (e.g., on a highway), stopping purely by braking within a short distance can be physically impossible (, exceeding the friction limit in §4.D). But steering into an open shoulder with only of lateral acceleration can avoid the collision entirely — which is why scenario libraries include both longitudinal and lateral escape maneuvers.
Q: Is RSS a mandatory standard that every manufacturer uses?
INTERPRETATION — No. RSS is a formal model Mobileye proposed and openly published in 2017; some manufacturers have adopted it, others have developed their own similar frameworks. There is no single universal mathematical model mandated by any regulator — but the idea of “defining a mathematically provable safety envelope” is on the roadmap of most serious AV developers who want to go beyond relying on statistical simulation testing alone.
Summary
- Fixed test procedures cannot cover the combinatorially exploding state space of autonomous driving; scenario-based testing — the functional → logical → concrete hierarchy — is used instead.
- ASAM OpenDRIVE (static road geometry) and OpenSCENARIO (dynamic actors/triggers) make scenarios portable across simulators and OEMs.
- TTC/ETTC, PET, and DRAC objectively quantify how “close” a scenario came to a collision even when none occurred; minimum TTC ties directly back to AD-12’s AEB thresholds.
- Formal models like RSS go beyond statistical simulation confidence to offer a physics-based, mathematically provable safety envelope — but they are not a single universal industry standard.
- A single parameterized scenario template (e.g., a pedestrian crossing) can be systematically expanded into hundreds or thousands of concrete test variations via criticality-based sampling.
Sources and Verification Note
The scenario hierarchy draws on ISO 21448 (SOTIF) and the abstraction structure of the PEGASUS research consortium; ASAM OpenSCENARIO/OpenDRIVE are this lesson’s standard data-model references. Safety metrics and speed/deceleration thresholds are drawn from Euro NCAP test protocols. The RSS model is based on Shalev-Shwartz, Shammah, and Shashua’s (Mobileye) 2017 proposal “On a Formal Model of Safe and Scalable Self-Driving Cars”; the degree to which this specific model has been adopted by other OEMs varies and is marked as ASSUMPTION.
Next Lesson
- AD-24 — Edge Cases and Rare Events in Autonomous Driving: No matter how broad a scenario library gets, some situations remain in the real world’s “long tail” — never entered into the library at all. We examine how these are systematically discovered and managed.
Technical Diagrams
Quiz
What does the Time-to-Collision (TTC) metric fundamentally quantify?
TTC calculates the time remaining before a collision occurs between the ego vehicle and a slower lead obstacle assuming relative velocity remains constant.
What is the functional division of responsibility between ASAM OpenDRIVE and ASAM OpenSCENARIO?
ASAM OpenDRIVE standardizes static road infrastructure networks, whereas ASAM OpenSCENARIO defines dynamic entity trajectories and scenario triggers.
In the Mobileye RSS longitudinal safety distance equation, what does the parameter 'rho' (ρ) denote?
In RSS, rho (ρ) accounts for the worst-case time window required by perception, planning, and brake hydraulic build-up to initiate deceleration.
What does it signify when the computed DRAC metric exceeds the physical tire-road friction threshold (μ * g)?
DRAC represents the minimum deceleration needed to stop in time; if it surpasses available tire-road friction (μ * g), braking traction saturates and impact is inevitable without evasive steering.
Glossary
| English Term | Definition |
|---|---|
| Responsibility-Sensitive Safety (RSS) | A physics-based (reaction time + both vehicles' braking capability) mathematically provable safe following/lateral distance framework proposed by Mobileye — offers an auditable safety guarantee distinct from purely statistical/simulation-based confidence. |
| Global Vehicle Target (GVT) | A radar/LiDAR-reflective, inflatable/soft, realistic vehicle target used in physical test/validation stages (including Euro NCAP protocols) for systems like AEB, allowing safe collision-risk testing without damaging a real vehicle if actually struck. |
| Post-Encroachment Time (PET) | The time between when the first road user leaves a traffic conflict point and when the second road user arrives at it — a related but distinct traffic-conflict safety metric from TTC, measuring how 'close' a near-miss was even when no collision occurred. |