
Rooftop Solar in the US Has Grown Fivefold Since 2015, and California Still Owns the Map
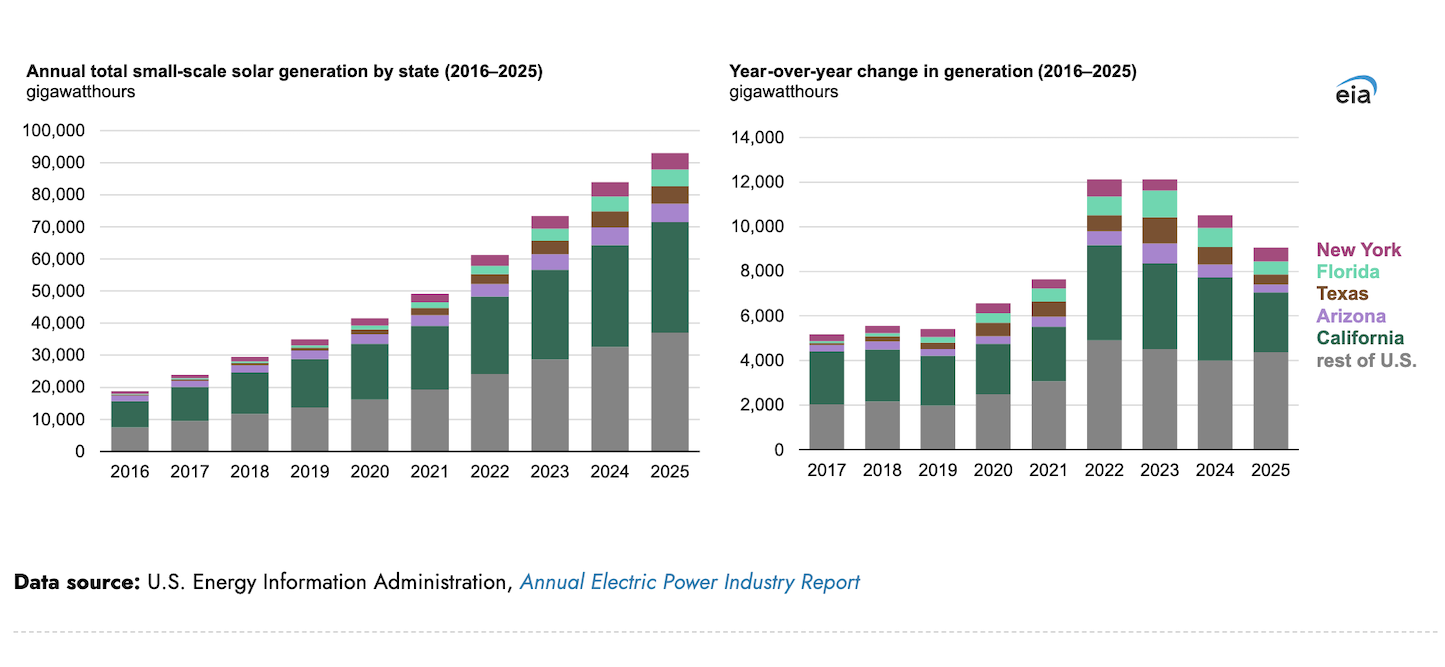
Rooftop and other small-scale solar systems in the United States — anything under 1 megawatt of capacity — churned out roughly 92,979 gigawatt-hours in 2025. A decade earlier the figure sat at 18,812 GWh. That is a fivefold jump, and while the headline number keeps climbing, the pace behind it has cooled since 2022.
The geography is predictable in some places and surprising in others. California, Arizona, Texas and Florida lead the country, which makes sense: those are the states with the strongest sunshine. California alone delivered 34,411 GWh in 2025, or 37% of the national total, with its installed small-scale capacity rising from 18 gigawatts in 2024 to 20 GW last year.
What Happened in 2022
Generation jumped 25% year over year in 2022 as capacity records fell. A big chunk of that came from policy timing rather than weather.
California’s Net Energy Metering 2.0 scheme stayed open until April 2023 and paid homeowners more for the power they exported than the replacement Net Billing Tariff (NEM 3.0) does. Anyone who got in under NEM 2.0 kept the older, richer terms — so installers had a hard deadline to beat, and homeowners had a reason to move fast. The rush shows up directly in the 2022 numbers.
Arizona is the second-largest producer at 5,795 GWh, a little over 6% of the US total. Its growth in 2025 was a modest 6%, but the state posted a 22% spike between 2022 and 2023. A 25% state income-tax credit, alongside other incentives, keeps panels moving off the shelves there.
Texas and Florida tell the more dramatic story. Texas went from 391 GWh in 2016 to 5,408 GWh last year. Florida climbed from 205 GWh to 5,198 GWh across the same stretch. Property tax exemptions and utility-level programs in both states have done much of the lifting.
Then there’s New York, the odd one out. It ranks fifth nationally despite sitting in a region with weaker solar resources, a position built on state incentives and better panel technology rather than raw sunshine. New Jersey, Massachusetts and Illinois run comparable programs and are seeing similar results.
How the Numbers Are Actually Counted
One caveat worth knowing: utilities rarely have a clear picture of how much power rooftop systems on their own distribution networks actually produce. The US Energy Information Administration gathers customer counts and aggregated capacity through utility surveys, then models the generation using tools like the National Renewable Energy Laboratory’s System Advisor Model and PVWatts, applying California tilt-angle and orientation data as a stand-in for the rest of the country. In other words — these are solid estimates, not meter readings.
The decade-long curve bends upward clearly. It just bends a little more gently now than it did three years ago, and the policy deadlines of the early 2020s are a large part of the reason why.
Source: CleanTechnica
Curious how this compares to other EVs? Try our comparison tool →What do you think?