
- List the TCO (total cost of ownership) components and explain why purchase price alone is a misleading comparison.
- Explain the structural reasons EV energy cost differs between home, workplace, and public DC fast charging.
- Summarize the structural (not price-specific) drivers of lower routine maintenance in an EV.
- Explain how depreciation and battery warranty/residual value interact in EV ownership.
- State that the ICE vs EV TCO comparison depends on country, usage profile, and time horizon rather than having one universal answer.
EV-40 — Economics / TCO
ASSUMPTION — This lesson explains the TCO concept and its components, not concrete prices. Purchase prices, electricity/fuel tariffs, incentives, and taxes vary by country and change over time; no specific currency figure is given here. Where a number is needed to illustrate a relationship, it is described qualitatively (higher/lower, faster/slower) rather than as a fixed value.
1. Why Purchase Price Alone Is Misleading
It is tempting to compare two vehicles by looking only at the sticker price, but that number captures a single moment in a multi-year relationship between an owner and a vehicle. Total cost of ownership (TCO) instead sums every cost incurred over a defined holding period — typically several years or until resale — into a single comparable figure. This matters especially for EVs because their cost structure is shaped differently across time than an ICE vehicle’s: a larger share of an EV’s lifetime cost tends to sit in the upfront price (largely driven by the battery pack), while a larger share of an ICE vehicle’s lifetime cost tends to accumulate later, through fuel and maintenance spread across years of driving. Comparing only the upfront number therefore systematically favors whichever vehicle front-loads less of its total cost — which is not necessarily the cheaper vehicle overall.
FACT — TCO is only meaningful when compared over the same holding period and similar usage profile (annual distance, charging/fueling mix); comparing a 3-year TCO for one vehicle against a 7-year TCO for another produces a distorted result.
2. The Full Set of TCO Components
A complete TCO calculation draws on several cost categories, each of which behaves differently over time:
| Component | What it captures | Typical trend over ownership |
|---|---|---|
| Purchase price (net of incentives) | Upfront capital outlay | Fixed at purchase |
| Energy cost | Electricity (or fuel) consumed | Accumulates with distance driven |
| Maintenance | Scheduled service, wear items | Accumulates, often non-linearly |
| Insurance | Risk-based periodic premium | Recurring, can shift with vehicle value/repair cost |
| Registration / tax | Government levies, which vary by policy on EVs | Recurring or one-time, policy-dependent |
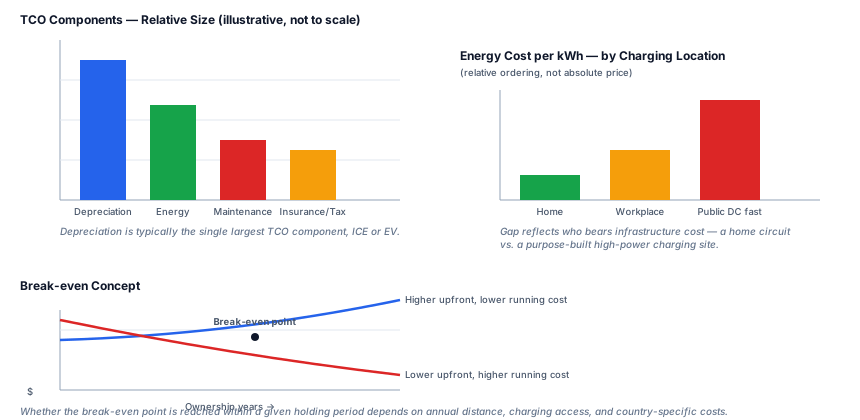
| Depreciation | Loss of resale value over time | The single largest component for most vehicles |
| Battery warranty / residual value | Risk transfer + resale confidence | Affects perceived and actual resale value |
FACT — For most vehicles, ICE or EV, depreciation is the single largest component of TCO over a typical ownership period — larger than fuel/energy or maintenance combined in many cases. This is one reason resale value deserves as much attention as running costs when comparing vehicles.
3. Energy Cost: Why Location of Charging Matters Structurally
Unlike a fuel station, which is a single type of purchase, “charging an EV” spans several structurally different transactions, each with a different underlying cost basis.
- Home charging typically draws on a household’s standard residential electricity tariff, often at off-peak hours if the owner or utility incentivizes it. Because there is no dedicated charging-station infrastructure or margin layered on top, this is usually the least expensive way to charge.
- Workplace or destination charging (retail, hotel) frequently uses a similar or subsidized tariff, sometimes free as an amenity, but availability and speed vary widely.
- Public DC fast charging involves a charging network operator that has invested in high-power hardware, grid connection upgrades, and site costs; that capital and operating cost is recovered through the price charged per session or per kWh, which is why fast charging is structurally the most expensive charging mode even before considering any regional tariff differences.
FACT — The cost gap between home and public DC fast charging is structural, not incidental: it reflects who bears the infrastructure investment (a household’s existing electrical service vs. a purpose-built high-power charging site), not merely a pricing choice. Drivers who rely mostly on public fast charging will structurally see a higher effective energy cost than those who charge mostly at home, independent of country.
4. Maintenance: Structural Drivers, Not Just “EVs Need Less”
The common claim “EVs need less maintenance” is directionally correct but worth unpacking structurally rather than accepting at face value.
Lower maintenance needs come from real mechanical facts: there is no engine oil, oil filter, spark plugs, or timing components to service, because there is no internal combustion process (EV-01); regenerative braking reduces mechanical brake pad wear because the electric machine absorbs part of the deceleration (EV-08); and a single-speed reduction gearbox has fewer wear parts than a multi-speed automatic transmission.
But the picture is not uniformly lower. EV curb weight is typically higher than a comparable ICE vehicle due to the battery pack, and instant torque delivery from a standstill can increase tire wear rate (EV-44); tires are therefore a maintenance category where EVs can cost more, not less, over time. HV battery and coolant-system service, while infrequent, requires specialized (and sometimes costlier) diagnostic and service capability when it is needed (EV-39).
INTERPRETATION — “Lower maintenance” is an accurate summary of the net effect for most owners, but it results from some categories going down sharply (fluids, brakes) while at least one goes up (tires) — it is not that every single maintenance category improves.
5. Depreciation and Battery Warranty
Depreciation — the loss of a vehicle’s value over time — is shaped for EVs by a factor that has no ICE equivalent: buyer confidence in the remaining useful life of the battery pack, since the pack is both the most expensive single component and the one most associated (rightly or not) with long-term reliability concerns in the public perception.
A battery warranty, typically expressed as a combination of years and distance with a stated minimum retained capacity (for example, guaranteeing the pack will not fall below a certain percentage of its original capacity within that window — see EV-41 for how that capacity actually degrades), functions as a risk-transfer mechanism: it moves the financial risk of unexpectedly fast degradation from the buyer to the manufacturer, which in turn supports resale value because a used-EV buyer can rely on the warranty rather than needing to independently assess pack health.
FACT — A well-documented SOH (state of health) history, where available, can support resale value in the same way a documented service history supports resale value for an ICE vehicle — both reduce the buyer’s uncertainty, and uncertainty is what depresses resale prices.
6. The ICE vs EV TCO Comparison Framework
Rather than asking “is an EV cheaper overall,” it is more productive to ask “under which usage profile does an EV’s TCO advantage — or disadvantage — emerge, and how quickly.” The relevant variables are:
- Annual distance driven — higher annual distance means energy/fuel and maintenance differences compound faster, generally favoring the vehicle with the lower per-distance running cost.
- Charging access — an owner with reliable home or workplace charging captures the largest energy-cost advantage; an owner relying mostly on public fast charging captures a much smaller one, or none.
- Holding period — a short holding period weighs the upfront price more heavily (through depreciation of that price); a long holding period lets lower running costs accumulate enough to offset a higher purchase price.
- Country-specific policy — purchase incentives, energy taxation, and ongoing vehicle taxes vary enormously by country and change over time, which is why no single “EVs are/aren’t cheaper” statement holds globally or permanently.
ASSUMPTION — Because of the last point, any concrete cross-country TCO comparison requires current, country-specific data and is outside the scope of this conceptual lesson; the framework above is intended to let a reader build their own comparison correctly rather than to supply a ready-made number.
7. FAQ
Where does an EV’s TCO advantage typically come from, when it exists?
FACT — Primarily lower energy cost (especially with home charging) and lower routine maintenance (no oil/fluids, less brake wear); these can be partly offset by tire wear, insurance differences, and a higher upfront price.
Does a higher purchase price always mean a worse deal?
FACT — No — it depends on the holding period and usage profile. A higher purchase price can still result in a lower TCO if running-cost savings accumulate enough over the ownership period to outweigh it; this is the “break-even” logic behind TCO analysis.
Why can’t this lesson just state “an EV costs X% less to own”?
FACT — Because purchase incentives, energy and fuel prices, and tax treatment differ by country and change frequently; a specific percentage would be accurate only for one place at one point in time and would mislead everywhere else.
8. Summary
- TCO sums purchase price, energy, maintenance, insurance, tax, and depreciation over a defined holding period — comparing purchase price alone is misleading.
- Depreciation is typically the largest single component of TCO, for both ICE and EV vehicles.
- Home charging is structurally the cheapest energy source; public DC fast charging is structurally the most expensive, because of who bears the infrastructure cost.
- EV maintenance is lower in most categories (fluids, brakes) but can be higher in at least one (tire wear), so “lower maintenance” is a net effect, not a universal one.
- Battery warranty acts as a risk-transfer mechanism that supports resale value by reducing buyer uncertainty about pack health.
- The ICE vs EV TCO comparison depends on annual distance, charging access, holding period, and country-specific policy — there is no single universal answer.
9. Sources and Verification Note
No country-specific price, tariff, incentive, or tax figure is used in this lesson; all such figures must be sourced from current, country-specific data before being used in any real comparison.
- U.S. Department of Energy, Alternative Fuels Data Center (AFDC) — general vehicle cost and energy-economics framework.
- U.S. Department of Energy — Vehicle Cost Calculator methodology — TCO component structure (conceptual reference, not a source of live figures).
ASSUMPTION — Source versions/titles may change; every source must be re-verified before publication.
Next Lesson
- EV-41 — Battery Degradation: calendar and cycle aging.
Technical Diagrams
Quiz
What does TCO cover?
TCO covers total ownership cost (purchase + operation).
Which charging is usually cheaper?
Home charging is usually cheaper than DC fast charging.
Which cost is usually lower in an EV?
Without engine oil/spark plugs, EV maintenance is usually lower.
Why is depreciation important in TCO?
Depreciation is a major component affecting long-term ownership cost.
What does the ICE vs EV TCO comparison depend on?
ICE vs EV TCO depends on electricity/fuel prices, incentives, and usage.