
Tesla's Robotaxi Miles Are Compounding at 20% a Week — and the Waymo Crossover Math Is Brutal
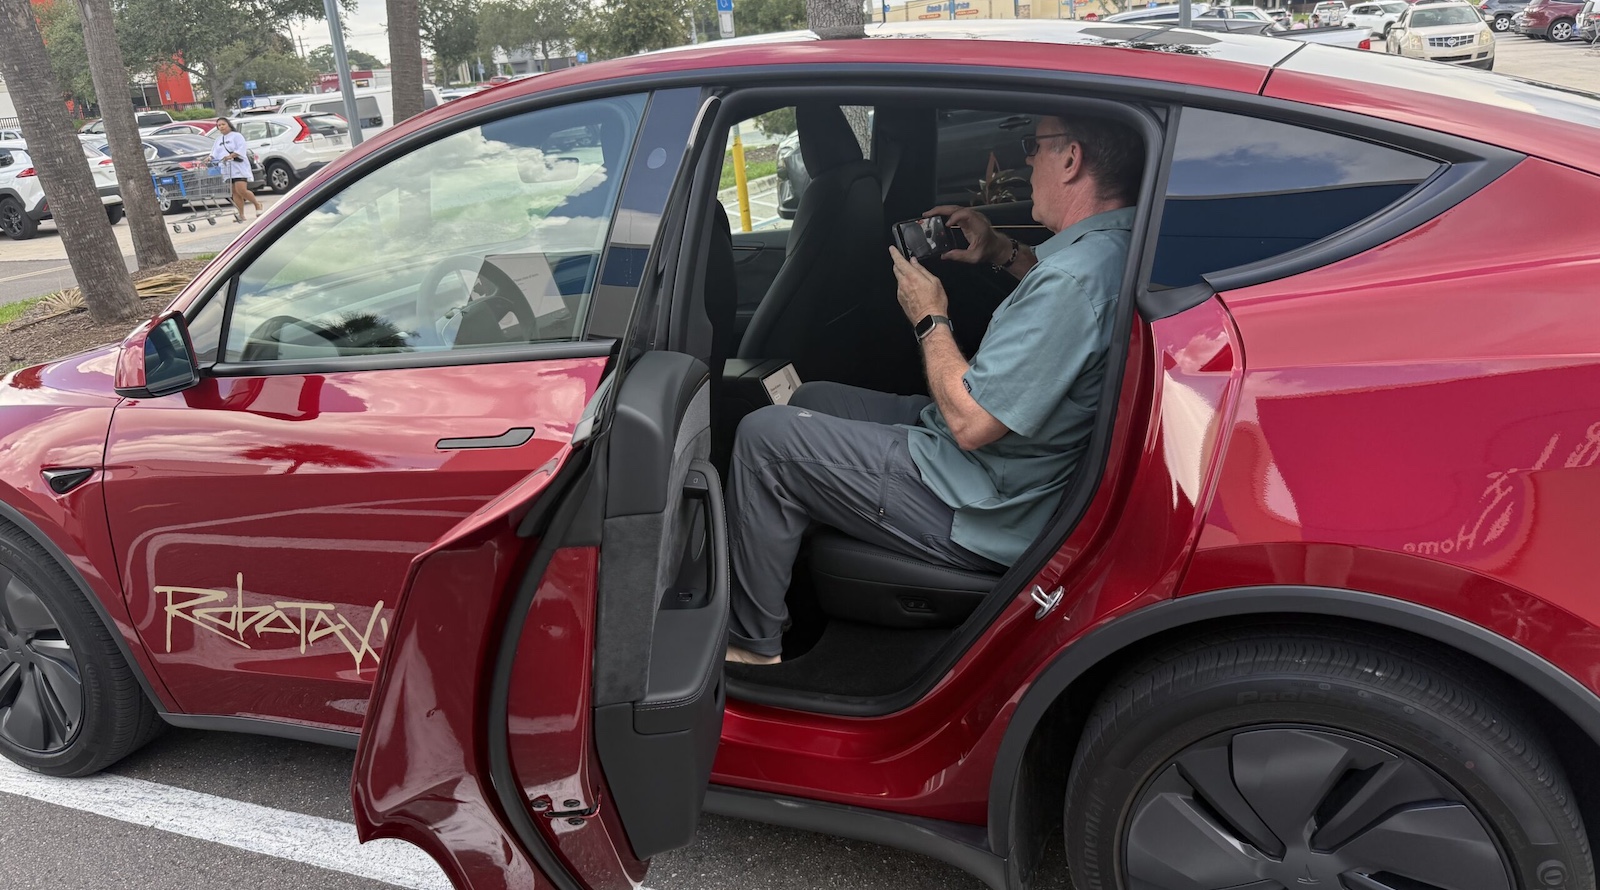
Tesla closed one week in October with 438,000 driverless miles logged in Austin alone, according to third-party tracking data. That figure sits just above the ~406,000 weekly miles Waymo reported for Q2 2026 — the first time the two have traded places on Tesla’s home turf.
Different reporting periods, so treat the comparison with some caution. Waymo’s next disclosure will settle it. Still, the direction of travel is what matters here.
The compounding curve
Tesla’s unsupervised mileage has been climbing fast. The company reported roughly 250,000 unsupervised miles in Q3, then about 1.7 million by the earnings call — and confirmed 3.3 million the same day. Run the numbers and you land near 20% weekly growth.
If that rate holds even for a short stretch, the national picture shifts quickly.
The projection: Starting from ~558K national unsupervised miles per week, Tesla would clear Waymo’s ~4 million weekly total by around week 11. By week 16, weekly volume would approach 10 million miles.
That 16-week mark is meaningful. Uber and Lyft together move an estimated 10–14 million paid passenger miles per week across Austin, Dallas–Fort Worth and Houston. Ten million miles would be more than half that combined total.
Waymo’s growth has cooled
For context, Waymo added about 50.7 million rider-only miles in Q2 2026 against 49.9 million in Q1 — sequential growth of only ~1.6%. A year earlier, quarterly growth was running at 15% or better.
City-level numbers tell the same story:
- Phoenix: two consecutive quarterly declines
- Austin: quarter-over-quarter growth fell from over 100% in early 2025 to about 4% by Q2 2026
- Los Angeles: around 9%
- San Francisco: around 13%
- Atlanta: faster growth, but off a small base
None of this means Waymo is in trouble. It has a huge installed base and a real business. It just isn’t expanding at launch velocity anymore — a natural S-curve shape.
Price is the real demand lever
Ride-hail substitution is only part of the addressable market. If Tesla prices rides at roughly half of Uber’s rate, trips that people currently drive themselves start to look expensive by comparison.
The three metros generate hundreds of millions of private vehicle-miles each week. Even a 1–2% shift toward robotaxis adds several million weekly miles on its own. Some transit journeys through CapMetro, DART and Metro could also become competitive on cost.
Geofences matter here. Tesla’s Dallas zone already spans roughly 81 square miles with over 600,000 cumulative unsupervised miles — larger than its early Austin footprint. Houston is smaller: about 25 square miles and ~226,000 cumulative miles.
What could break the streak
Sustaining 20% weekly growth for 16 straight weeks is an operations question, not a demand one. Several things could stall it:
- Fleet scaling: every new vehicle needs charging capacity, maintenance and depot space.
- Geofence approvals: Dallas and Houston need mapping work, local permits and public buy-in to reach Austin-scale coverage.
- Utilization slippage: empty, charging or idle cars drag down miles per vehicle and push the required fleet size higher.
- Cost assumptions: if insurance, remote assistance or cleaning run above plan, the half-price strategy narrows or disappears.
- A single incident: one high-profile event triggering a regulatory pause in any of the three cities flattens the curve immediately.
Tesla isn’t chasing Waymo on percentage growth for its own sake. The goal is proving that unsupervised Cybercab and Model Y operations work at scale, with revenue becoming visible in 2027. The recent mileage data is the strongest public signal yet that the software has cleared Tesla’s internal quality bar in its launch cities.
Whether the cars, the zones and the operations actually arrive on that schedule — that’s the part nobody can project with a spreadsheet.
Source: CleanTechnica
What do you think?