
Alaska's Roads and Runways Sit on Ground That's Melting — and Drones Are Mapping the Risk
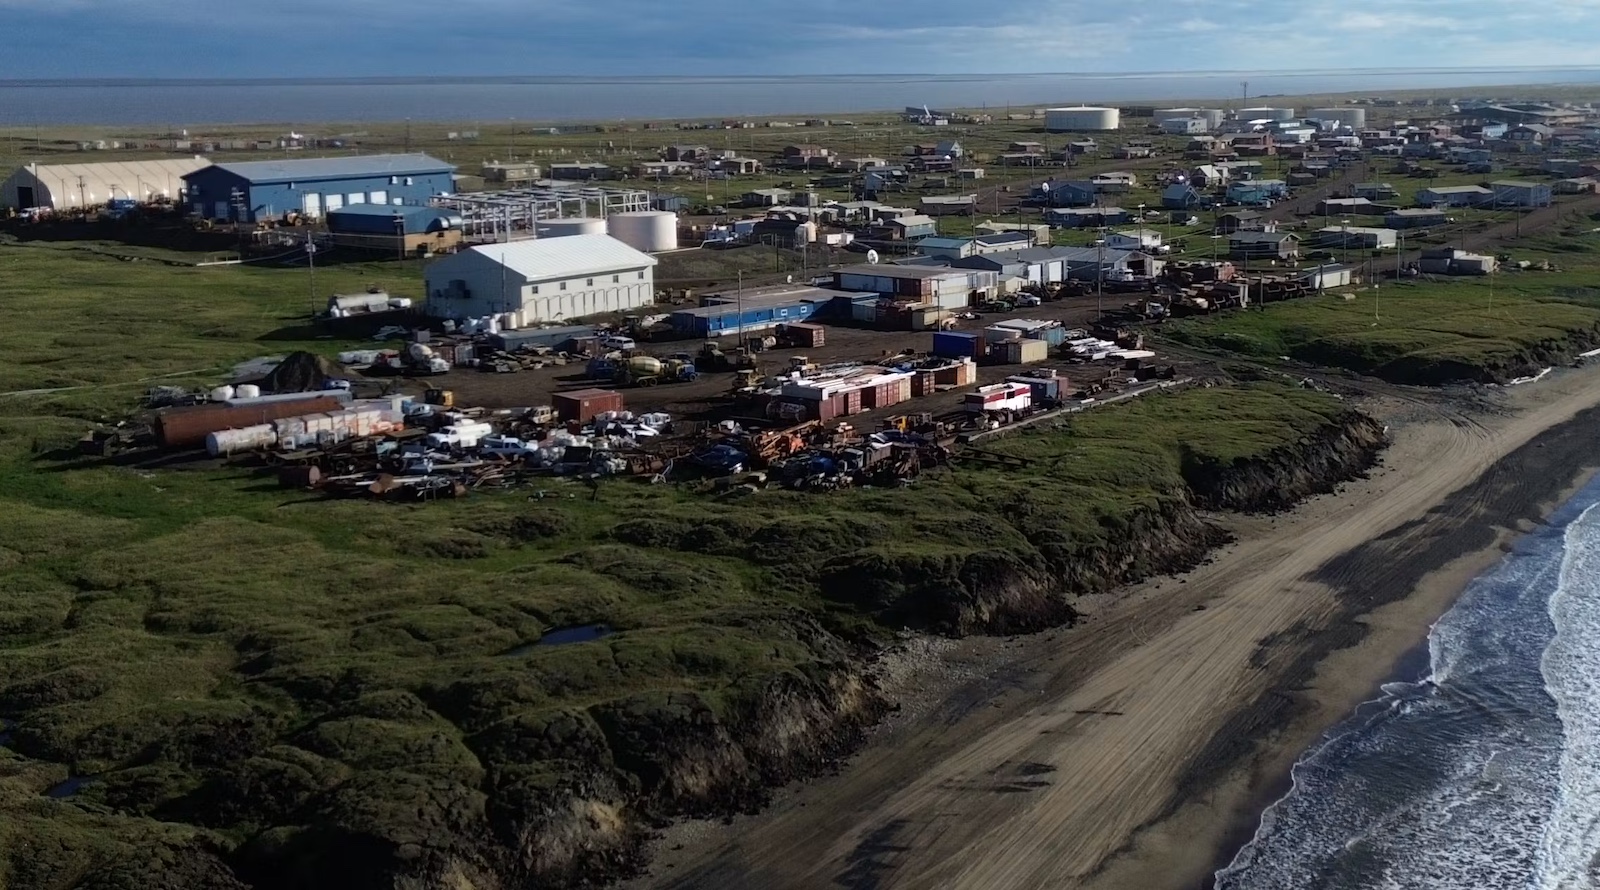
Wainwright, Alaska looks orderly from a plane: a tidy strip of houses and streets pinned between the Chukchi Sea and flat tundra. Underneath, though, the ground holds enormous wedges of ice. Where coastal bluffs erode, that ice is now exposed and disappearing.
The consequences go well beyond scenery. Permafrost — soil that stays at or below freezing for at least two straight years — loses its load-bearing strength when the ice inside it turns to water and drains away. Foundations settle, roads buckle, pipelines can crack. A 2025 estimate put the bill for building and road damage across Alaska from thawing permafrost at somewhere between $37 billion and $51 billion.
Why boreholes alone won’t cut it
Ming Xiao, a civil engineering professor at Penn State, has spent about ten years watching Arctic ground respond to warming that runs two to three times faster than the global average. A regional thaw map, she argues, tells a builder almost nothing about how one specific foundation will hold up.
The traditional answer is drilling. Dense grids of boreholes give precise samples, but they are costly, slow and disruptive — and they punch holes in terrain that is already fragile.
So Xiao’s team is testing something lighter. Their tool of choice is very low frequency electromagnetic surveying (VLF-EM), which reads signals from distant transmitters and watches how the ground reacts. No ground contact is needed, which means a small sensor can fly beneath a drone over wetlands and tundra that are hard or unsafe to walk on.
Salt water tells the story
Coastlines are where the method earns its keep. Unfrozen salty water conducts electricity far better than ice-rich frozen soil, so the contrasts picked up by the survey can flag ground that has already thawed. Depth readings come with uncertainty — VLF-EM is a pointer, not a photograph — but it shows engineers where a closer look is warranted.
Because infrastructure is built to last 20, 50 or more years, mapping today’s conditions is only half the job. Xiao’s group works on projecting two numbers engineers actually use: how much the surface will settle, and how much load a foundation can still carry.
A 2026 study looked at the Arctic Coastal Plain, the northern strip that takes in Prudhoe Bay and much of Alaska’s oil operations. Under a high-emissions path, the share of infrastructure at risk stays under 10% around mid-century, then climbs sharply in the 2060s through 2080s. By the 2090s, the projections put roughly 80% of buildings, 60% of roads and 90% of pipelines in danger from sinking ground.
The team is also building digital twins — computer replicas of real sites that update as sensors feed them data. At a road embankment in Utqiaġvik, fiber-optic cables gathered temperature and seismic readings along a stretch of about 330 feet (100 meters). Those measurements now feed a model that blends heat-transfer physics with machine learning, refining its forecasts each time fresh data arrives.
Ground-based electrical resistivity tomography, run along the coast at Wainwright, provides the detailed cross-sections needed to check what the airborne surveys suggest.
For Arctic communities, the practical value is time. Tools that show where a hazard is forming, how it may shift over decades and which buildings or roads stand in its path let people decide where to monitor, reinforce, repair — or move. Permafrost thaw gets framed as an environmental story. In the Arctic, it is just as much an engineering one.
Source: CleanTechnica
What do you think?